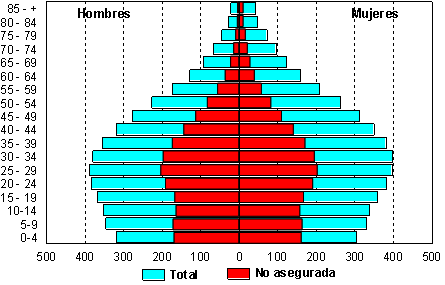
| Población total, sin seguridad social | Cuadro 1.9 | |||||||||||
| y asegurada por grupo de edad y sexo 2008 | ||||||||||||
| Grupo | Población total | Población sin seguridad social | Población asegurada | |||||||||
| de edad | Total | Hombres | Mujeres | Total | Hombres | Mujeres | Total | Hombres | Mujeres | |||
| Total | 8,836,045 | 4,271,913 | 4,564,132 | 3,859,963 | 1,925,981 | 1,933,982 | 4,976,082 | 2,345,932 | 2,630,150 | |||
| 0-4 | 623,902 | 318,966 | 304,936 | 330,304 | 168,890 | 161,414 | 293,598 | 150,076 | 143,522 | |||
| 5-9 | 676,397 | 346,404 | 329,993 | 335,650 | 171,748 | 163,902 | 340,747 | 174,656 | 166,091 | |||
| 10-14 | 690,840 | 352,048 | 338,792 | 321,282 | 163,615 | 157,667 | 369,558 | 188,433 | 181,125 | |||
| 15 - 19 | 726,961 | 367,864 | 359,097 | 334,099 | 166,766 | 167,333 | 392,862 | 201,098 | 191,764 | |||
| 20 - 24 | 766,247 | 383,873 | 382,374 | 382,464 | 191,340 | 191,124 | 383,783 | 192,533 | 191,250 | |||
| 25 - 29 | 784,316 | 387,697 | 396,619 | 405,833 | 202,917 | 202,916 | 378,483 | 184,780 | 193,703 | |||
| 30 - 34 | 778,079 | 379,990 | 398,089 | 392,655 | 197,231 | 195,424 | 385,424 | 182,759 | 202,665 | |||
| 35 - 39 | 737,238 | 355,611 | 381,627 | 344,239 | 173,226 | 171,013 | 392,999 | 182,385 | 210,614 | |||
| 40 - 44 | 668,268 | 318,478 | 349,790 | 284,756 | 143,863 | 140,893 | 383,512 | 174,615 | 208,897 | |||
| 45 - 49 | 588,729 | 276,656 | 312,073 | 223,496 | 112,938 | 110,558 | 365,233 | 163,718 | 201,515 | |||
| 50 - 54 | 490,135 | 226,777 | 263,358 | 165,528 | 82,764 | 82,764 | 324,607 | 144,013 | 180,594 | |||
| 55 - 59 | 382,070 | 174,016 | 208,054 | 114,929 | 56,393 | 58,536 | 267,141 | 117,623 | 149,518 | |||
| 60 - 64 | 288,743 | 128,944 | 159,799 | 77,200 | 36,693 | 40,507 | 211,543 | 92,251 | 119,292 | |||
| 65 - 69 | 216,101 | 93,468 | 122,633 | 51,470 | 22,840 | 28,630 | 164,631 | 70,628 | 94,003 | |||
| 70 - 74 | 162,835 | 66,976 | 95,859 | 36,918 | 14,776 | 22,142 | 125,917 | 52,200 | 73,717 | |||
| 75 - 79 | 117,002 | 45,244 | 71,758 | 26,610 | 9,662 | 16,948 | 90,392 | 35,582 | 54,810 | |||
| 80 - 84 | 74,316 | 27,070 | 47,246 | 16,789 | 5,584 | 11,205 | 57,527 | 21,486 | 36,041 | |||
| 85 - + | 63,866 | 21,831 | 42,035 | 15,741 | 4,735 | 11,006 | 48,125 | 17,096 | 31,029 | |||
| Fuente:
Secretaría de Salud/Dirección General de Información en Salud, Estimaciones
con base en las Proyecciones de la Población de México 2005 - 2030, CONAPO, 2006. |
||||||||||||
| Población total y población sin seguridad social por grupo de edad y sexo 2008 | ||||||||||||

|
||||||||||||